
GAFOR Colours: What Charlie, Oscar, Delta, Mike and X-Ray Mean
Anyone planning a VFR flight in Germany runs into GAFOR sooner or later. The name is short for General Aviation Forecast, a forecast the German Weather Service (DWD) issues for general aviation. For each area it boils the flying weather down to a single letter. The METARMAP uses the same five categories and turns each letter into a colour.
The five categories
Two values decide the category: visibility and cloud ceiling. The letters come from the phonetic alphabet, which is why pilots say Charlie, Oscar, Delta, Mike and X-Ray.
| Category | Meaning | Visibility | Cloud ceiling | Colour on the METARMAP |
|---|---|---|---|---|
| C (Charlie) | clear | 10 km or more | 5000 ft or more | blue |
| O (Oscar) | open | 8 km or more | 2000 ft or more | green |
| D (Delta) | difficult | 5 km or more | 1000 ft or more | yellow |
| M (Mike) | marginal | 1.5 km or more | 500 ft or more | orange |
| X (X-Ray) | closed | below 1.5 km | below 500 ft | red |
Charlie is the best VFR weather there is, with long visibility and high cloud or no closed cloud layer at all. Oscar is still good flying, the cloud just sits a bit lower. Delta means difficult: visibility is reduced or the ceiling is below 2000 ft, so the flight needs more planning. Conditions under Mike are marginal. And X-Ray means VFR flight is practically impossible, for example in fog or very low cloud.
Check the limits at your own airfield
Our METAR decoder works out the category for every current METAR, with the same table as above. Type in an identifier and you can see where your airfield stands:
How the METARMAP works it out
From every METAR, the METARMAP and the METARMAP Mini work out the GAFOR category and light the airfield's LED in its colour. The worse of the two values always decides: visibility or cloud ceiling. See the maps →
| Visibility ↓ / Cloud ceiling → | 500 to 1000 ft | 1000 to 2000 ft | 2000 to 5000 ft | above 5000 ft, no cloud |
|---|---|---|---|---|
| over 10 km | M2 | D1 | O | C |
| 8 to 10 km | M2 | D1 | O | O |
| 5 to 8 km | M5 | D4 | D3 | D3 |
| 1.5 to 5 km | M8 | M7 | M6 | M6 |
| below 1.5 km | X | X | X | X |
Calculated from the observation itself. The official GAFOR by the DWD is a forecast for areas.
The worse value decides
You need two rules to read the table correctly.
First, the less favourable of the two values always wins. With 12 km visibility and a cloud layer at 800 ft, an airfield ends up in Mike despite the excellent visibility. High cloud doesn't help either if visibility is only 4 km; that also gives Mike.
Second, a layer only counts as the ceiling if it covers at least five eighths of the sky. In a METAR those are the groups BKN (five to seven eighths) and OVC (eight eighths). A few scattered clouds at 600 ft leave the category alone, while a solid layer at the same height pulls it down. Our article on how to read a METAR shows what these groups look like in the report.
The METARMAP legend
Every METARMAP ships with this legend in print. It lays the categories out as a grid, with the cloud ceiling rising upwards and visibility increasing to the right. Where the two values meet, you find the category and its colour.
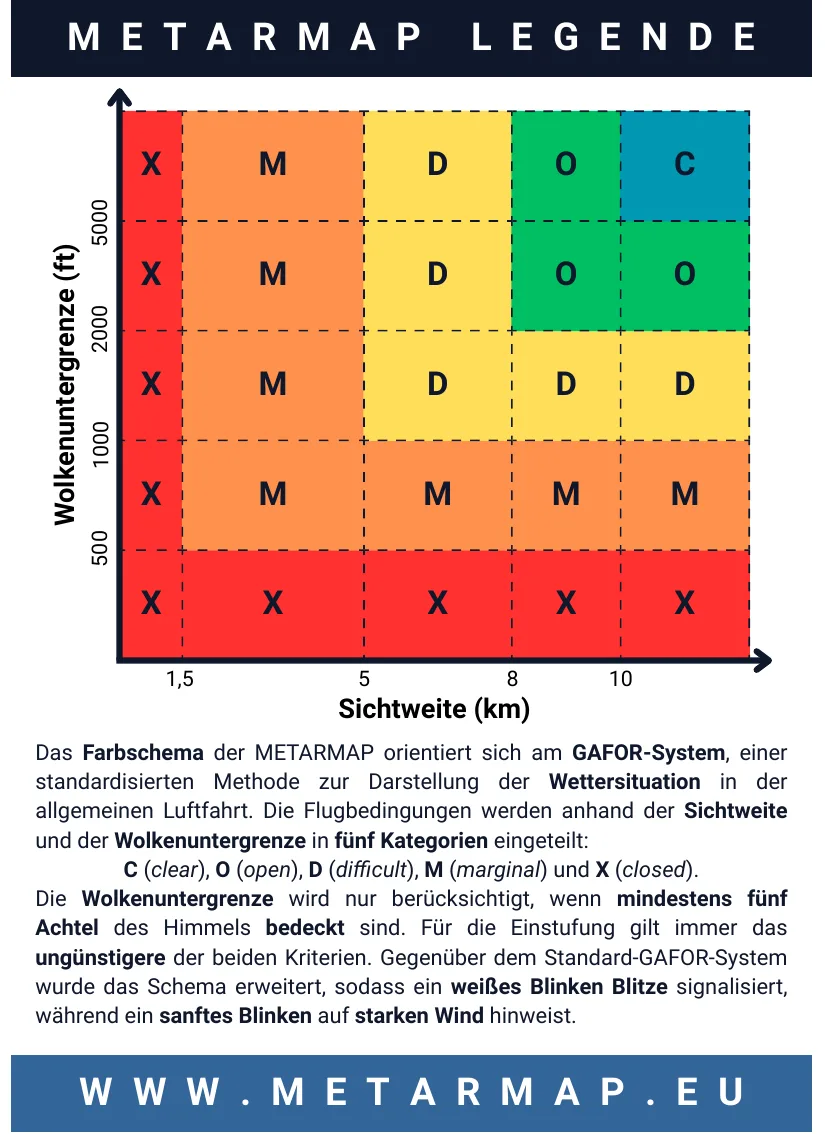
The grid also shows why an airfield so rarely glows blue. Charlie needs both 10 km visibility and no closed cloud layer below 5000 ft. A layer at 4500 ft is enough to turn a clear day into Oscar.
Blinking, lightning and dark LEDs
The METARMAP shows two things on top of the GAFOR scheme. If the wind reaches 15 knots or the airfield reports gusts, the LED blinks between its colour and a darker shade of it. White blinking means lightning. You can change the wind limit and every colour in METARMAP Connect.
A dark LED means there is no usable report for that airfield right now. For airfields on the edge of the map, it can also mean the edge LEDs are switched off in Connect.
Forecast or observation
The DWD's GAFOR is a forecast for areas, and it measures the ceiling from a reference height for each area. The METARMAP applies the same limits to the METAR, which is the current observation at the airfield itself. So what you see is the weather now, not the weather in three hours.
The colours on your wall
If you'd rather see the categories every day than look them up during your briefing, the METARMAP shows them live for around 80 airfields.
Frequently asked questions
GAFOR stands for General Aviation Forecast. It's an aviation weather forecast by the German Weather Service for general aviation, and it sorts the weather of an area into five categories from C to X.
They are the letters C, O, D, M and X in the phonetic alphabet. They mean clear, open, difficult, marginal and closed, ranging from the best VFR weather to conditions where VFR flight is practically impossible.
That's how the scheme is defined: only a layer covering at least five eighths of the sky counts as the ceiling, which in a METAR means BKN or OVC. Scattered cloud below it doesn't change the category.